My Tasks
When should I visit My Tasks?
The My Tasks page lets you access, start, and resume your assigned tasks. This is where you open tasks to work on them. You can also view statistics on your work progress from the past few weeks, showing how much time you've worked and how productive you've been.
Initially, this page will outline tasks and provide guidance on how to find a task to work on. The available metrics and how you can use them are described at the bottom of the page in the section 'Task metrics.'
What is a task?
Well, it is what we use to produce annotated data. When a client orders annotated data, a chain of tasks are used to produce that annotated data. For example, to annotate one image and the vehicles in it, we might use multiple tasks:
- An annotate task to annotate the data from scratch. The team member working on the task receives an empty image and marks out the vehicles within it.
- A review task in which a quality manager can look at the annotation and decide if it is of sufficient quality and ready to send to the client.
- A review correct task where issues found in the review are corrected.
- Another review task to review the corrected issues.
To learn about our available workflows, please refer to the relevant chapter Annotation Workflows.
What types of tasks exist?
There currently exist four types of tasks: Annotate, Review, Review Correct, and Correct.
A task where you annotate from scratch or use preannotations as a starting point. You either begin with an empty scene and add annotations based on the provided guideline, or start with a partially annotated scene and continue annotating while fixing any issues with the existing preannotations.
Finding a task to work on
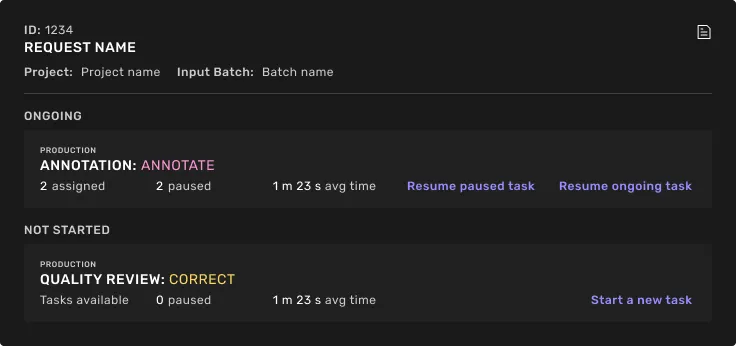
On the page, you can see all requests in which you can either start a new task or resume an already started task. The requests and their tasks are organized in different sections, depending on the purpose for which they are used. The sections are the following:
Production tasks are used to produce annotated data for an end customer. Here, you should focus on performing according to the task's time and quality expectations. What you produce and submit will be part of the end delivery.
ℹ️ The section can contain requests with assigned demo tasks if the request also contains available production tasks.
Understand your current and recent productivity
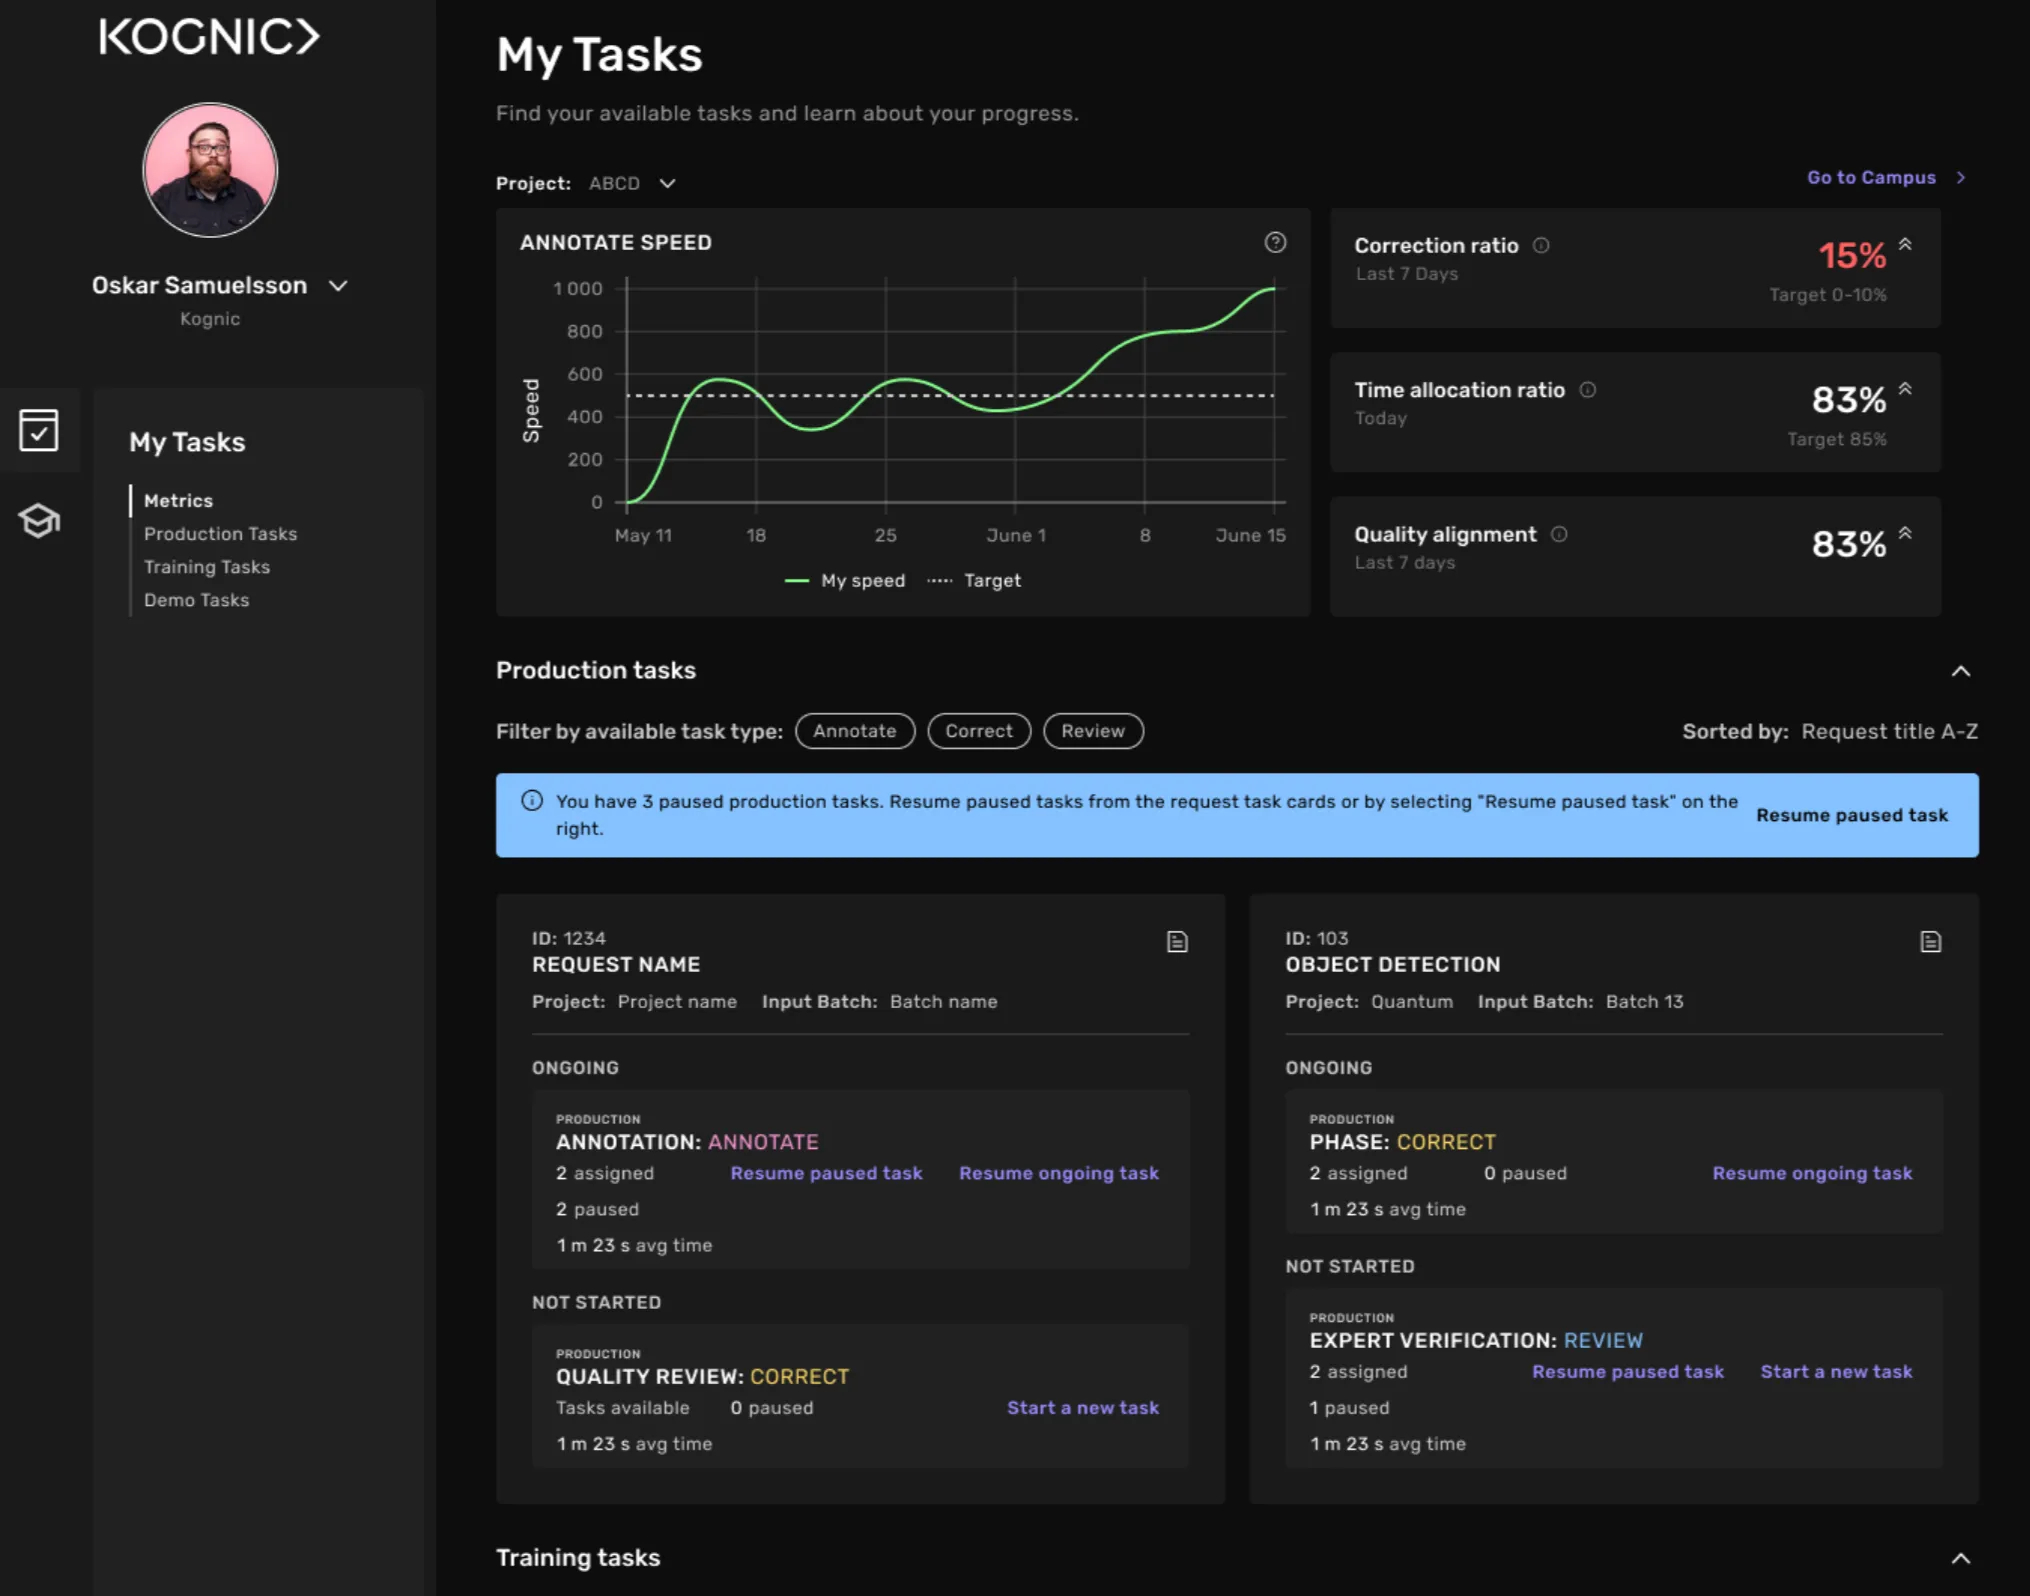
The metrics section at the top of My Tasks provides an overview of your recent performance, scoped to a selected project.
Project selector — A dropdown above the metrics area lets you choose which project's data to display. It defaults to the project you most recently worked on.
Speed chart (left side) — An "Annotate speed" line graph showing your daily annotation points per hour. A dashed target line shows the expected speed based on your project's annotation points target (APT). The legend shows "My speed" and "Target" labels.
KPI metric cards (right side, stacked vertically):
- Correction ratio — The share of your total task time spent on corrections over the last 7 calendar days, weighted by task time. Target: 0-10%, lower is better. Shown in red when above 10%.
- Time allocation ratio — The percentage of your reported time spent actively working in the task view over the last 7 calendar days, weighted by reported time. Target: 85%.
- Quality score — Your average quality score over the last 7 days, scoped to the selected project. Hover to see a breakdown tooltip showing Precision, Recall, Geometry accuracy, and Property accuracy with deltas from the previous period.
Each card shows the metric value, the measurement period ("Last 7 Days"), a target range, and a trend arrow. Hover a card to see the previous week's value for comparison.
You can learn more about your productivity via the Campus view, see related content below to learn more about them.
Related content: