User Productivity
This view is designed to help you gain even more insights into any given individual annotator and their performance. It gives a more in-depth view of the work that the annotator has done on each individual task.
1.Productivity
Path: Team Management ▶︎ Productivity Insights ▶︎User Productivity▶︎ Productivity Tab
Get a daily view of your annotation output—points, tasks, objects—and dig into each task’s details.

1.1 Select a Team Member
You are able to quickly select a team member by using the Team Member Selector (see image below), or by pressing a name in the table. It will then switch out the data, and display the selected team member.

1.2 Controls & Filters
- Time Interval Select any date range. By default, shows the last 7 days (daily granularity).
- Projects Filter metrics to one or more projects.
- Request Type Filter by request category.
- Task Type Choose between Annotate, Correct, Review, or All.
1.3 Trend Charts
Chart | What it shows |
|---|---|
Annotation Points per Day | Daily sum of annotation “points” (e.g. dataset‑specific scoring). The dotted line is your average over the selected interval. |
Tasks Completed per Day | Count of tasks you finished each day. Dotted line = average. |
Tip: Hover over any point on the chart to see the exact value and date.
1.4 User Productivity Table
A pageable table listing every task in the selected range:
Column | Description |
|---|---|
Task | Clickable task ID — opens the task in the annotation tool. |
Last Update | Timestamp of the most recent state change or submission. |
Category | Internal grouping (e.g. “productivity”, “training”...). |
Type | Task type: A = Annotate, C = Correct, R = Review, |
Status | Current status code (e.g. C = Completed, O = Ongoing, E = Expired). |
Annotation Points | Total points earned for that task (scoring rules vary by project). |
Annotation Time | Total time spent on the task (formatted as hh mm). |
Objects Produced | Number of individual objects annotated (sum of 2D + 3D instances). |
Shapes Produced | Total geometries created (object * frame count). |
2D Shapes | Count of 2D-only shapes. |
3D Shapes | Count of 3D-only shapes. |
2. Quality Alignment
Path: Team Management ▶︎ Productivity Insights ▶︎ User Productivity ▶︎ Quality Alignment Tab
This page provides statistics of your alignment on the expected quality and the error types the user has generated. This empowers pinpointing the user's most common issues and focus on targeted improvements. Note: The figures in the Quality Alignment tab that refer to errors are based on feedback— each “Error” corresponds to one feedback entry.
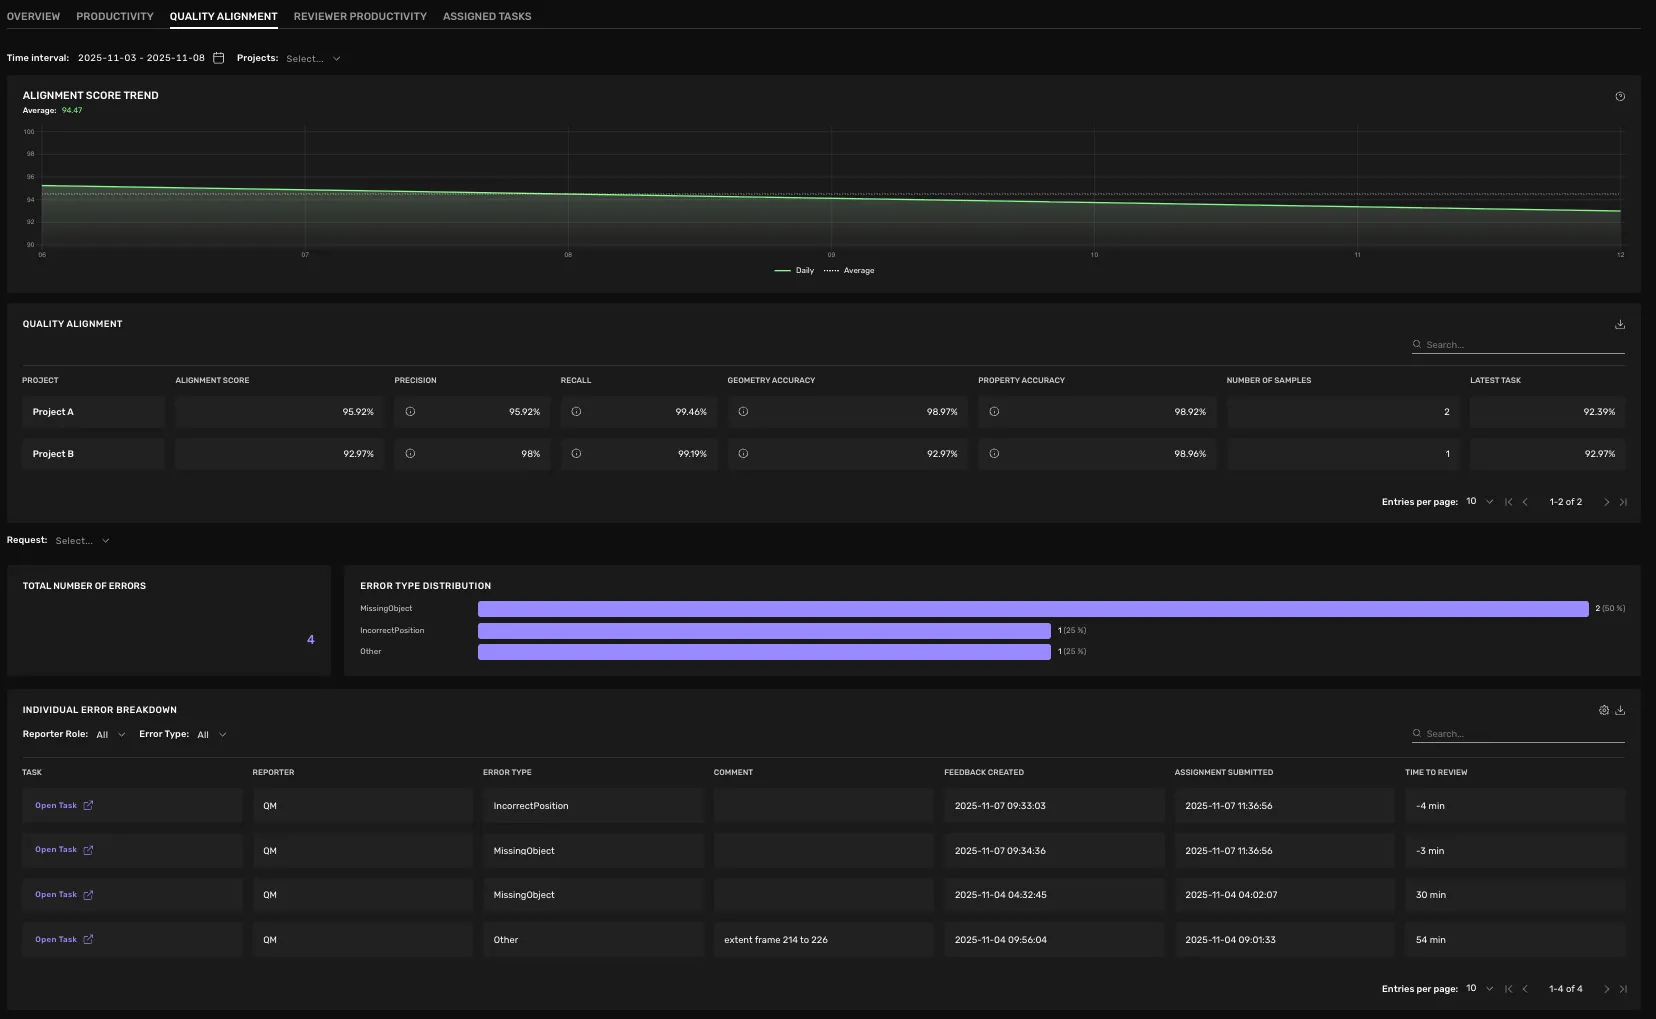
2.1 Controls & Filters
- Time Interval Choose any date range. This will affect both Alignment and Error content of the page.
- Projects Filter by project. This will affect both Alignment and Error content of the page.
- Request Type Filter by request. Only applicable for the Error content.
2.2 Alignment
For more detailed information about the alignment statistics, you can read the general documentation for Quality Alignmenthere.
2.3 Total Number of Errors
A summary card displaying the aggregate count of errors recorded in the selected time interval.
2.4 Error Type Distribution
Horizontal bar chart displaying each error type and its percentage, example.
Error Type | Count | % |
|---|---|---|
MissingObject | 2 | 67% |
FeedbackErrorType | 1 | 33% |
2.5 Individual Error Breakdown
A pageable table listing every feedback entry:
- Task Click Open Task ▶ to jump to the corresponding annotation.
- Reporter Who left the feedback (usually a Quality Manager), but could be a Lead, Client or Automatic Feedback.
- Error Type The error category which was selected when giving the feedback.
- Comment Free‑form notes on what’s wrong.
- Feedback Date Timestamp when the error was logged.
Filters above the table allow you to:
- Show only errors from certain reporter roles (e.g. QM, LQM).
- Filter by specific error types.
- Search by keyword in comments.
3. FAQs
Q: Who can see my errors?
A: Only you and users with QM/admin roles.