Alignment Analytics
Alignment Analytics
Prerequisites
To access Alignment Analytics, you need one of the following:
- A role with access to Request Management in your organization
- Kognic internal user access
- Pilot access for specific projects
You can find the page by navigating to a request in Request Management and clicking View alignment analytics on the request summary tab.
Overview
Alignment Analytics shows you how well annotation work aligns with review standards. It gives you a quality picture for a specific request — covering reviewed work, partially reviewed work, and estimates for unreviewed work.
Use this page to:
- Understand the quality level of delivered annotations
- Identify annotators whose work may need additional review
- Track whether review rounds are catching and correcting issues effectively
How It Works
Each time work passes through a review phase, the system compares the version before and after that phase. The reviewer may accept the work as-is or make corrections — either way, the system records every difference: shapes that were added, removed, or modified, and properties that were changed. These differences are turned into measurable quality metrics.
Think of it as a before-and-after comparison:
- Before: The work as it entered the review phase
- After: The work as it left the review phase (after the reviewer accepted or corrected it)
The smaller the difference, the higher the quality.
Quality Metrics
Quality is broken down into four sub-metrics:
Metric | What it measures |
|---|---|
Precision | How accurately annotators identify the correct objects |
Recall | How completely all objects in the scene are covered |
Geometry | How accurately shape boundaries match the ground truth |
Properties | How accurately object properties are set |
Each metric is displayed as a percentage. A score near 100% means almost no corrections were needed.
Quality Phases
The page shows three quality cards, each measuring quality at a different stage of the review workflow:
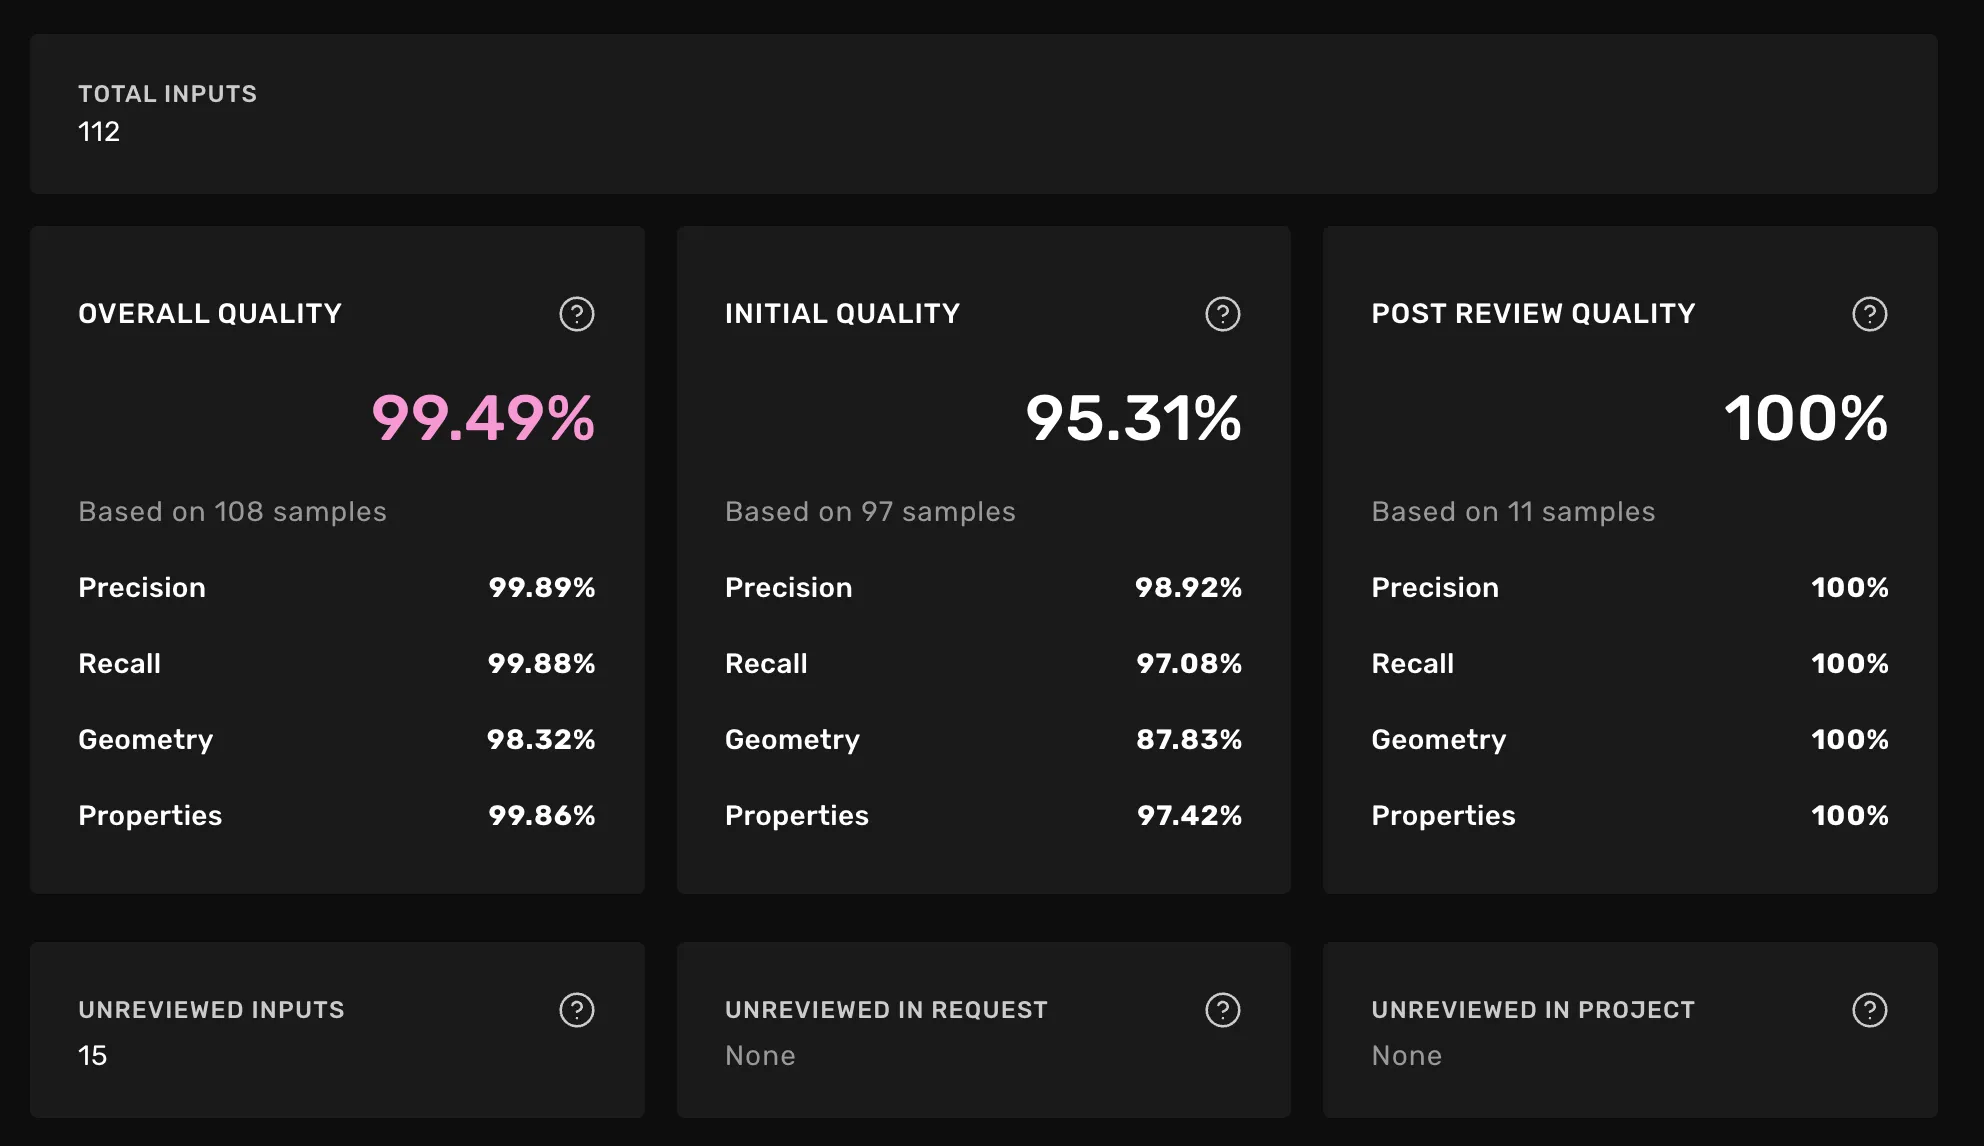
Initial quality
"How much did the first review round need to correct?"
This compares the annotator's original work to the output after the first review. A low score means the reviewer had to make significant corrections. A high score means the annotation was already close to the desired result.
Post-review quality
"How good is the work after the first review round?"
This compares the first review round output to the output after a second review. If this score is near 100%, the first review round produced work that needed almost no further corrections.
Overall quality
"What is the estimated quality of everything delivered in this request?"
This combines all available data into a single quality picture. It is the best estimate of the actual quality your customer receives. See Understanding the overall quality estimate for how this is calculated.
Understanding the Overall Quality Estimate
Not every assignment gets reviewed. The overall quality metric provides a complete picture by combining three types of data:
- Fully reviewed work (reviewed twice) — treated as the ground truth for quality measurement
- Partially reviewed work (reviewed once) — quality inferred from available review data
- Unreviewed work — quality estimated using the annotator's track record
How unreviewed work is estimated
The system estimates quality for unreviewed assignments by looking at reviewed work from the same annotator:
Estimation type | How it works |
|---|---|
Request sampling | Uses reviewed work from the same annotator in this request |
Project sampling | Uses reviewed work from the same annotator in other requests within the project |
No sampling available | No review data exists for this annotator anywhere in the project — quality cannot be estimated |
If some assignments cannot be estimated, a warning is displayed on the overall quality card.
Confidence Intervals
Every metric comes with a confidence interval that tells you how reliable the number is. The interval gets tighter as more data becomes available.
What to watch for:
- Wide intervals (e.g., 60%–95%) mean the metric could shift significantly as more reviews come in. Treat the score as an early indicator, not a definitive result.
- Narrow intervals (e.g., 88%–92%) mean the metric is stable and reliable.
Unreviewed Inputs
Below the quality cards, the page shows the distribution of unreviewed work:
- Unreviewed inputs — total number of inputs not yet reviewed in this request
- Unreviewed in request — annotators with no reviews in this request but reviewed elsewhere in the project (number of users and inputs)
- Unreviewed in project — annotators never reviewed anywhere in this project. These are flagged with a warning because their quality cannot be estimated.
Unreviewed inputs table
The table lists every unreviewed assignment with:
Column | Description |
|---|---|
Scene ID | The input identifier |
Name | The annotator who completed the work |
Estimated Quality | The estimated quality score (hover for sub-metric breakdown) |
Estimation type | How the score was calculated — request sampling, project sampling, or no sampling available |
You can filter the table by Estimation type to focus on specific groups. Right-click any row and select Open in task view... to see the assignment in the annotation tool.
Quality estimates in phase inputs
The same estimated quality scores shown in the unreviewed inputs table above are also available directly in the phase inputs table of Quality Review and Expert Verification phases. In those tables, inputs are sorted by estimated quality ascending by default, making it easy to prioritize reviewing the lowest-quality inputs first.
These scores use the lower bound of the confidence interval rather than the point estimate. This conservative approach means the platform shows the worst-case estimate within the confidence range, so a displayed score of 85% means "we are confident the true quality is at least 85%." As more review data accumulates and confidence intervals narrow, the lower bound converges toward the point estimate
FAQ
Why does the overall quality card show a warning?
Some annotators have no reviewed work anywhere in the project. The system cannot estimate their quality, so those inputs are excluded from the overall score. The warning tells you how many inputs are affected.
Why is an estimated quality score showing "N/A"?
This means there is no review data available to estimate quality for that annotator — neither in this request nor elsewhere in the project.
What's the difference between "Unreviewed in request" and "Unreviewed in project"?
"Unreviewed in request" means the annotator has been reviewed in other requests within the same project — we can still estimate their quality using project sampling. "Unreviewed in project" means the annotator has never been reviewed in this project at all — we cannot estimate their quality.
How can I improve the reliability of quality scores?
Review more assignments. As the number of reviewed samples increases, confidence intervals narrow and estimates become more stable. Prioritize reviewing annotators who appear under "Unreviewed in project" since those are your biggest blind spots.
Related
- Request Management — where you access Alignment Analytics from
- Annotation Workflows — how review phases work
- Roles and Permissions — access control details
- Quality AlignmentQuality Alignment - Analyze individual users alignment